Definition: Financial Statement Analysis is the assessment of the firm’s financial well-being. It determines relations among various items of the financial statements. Also, it helps in identifying strengths and specifying the areas of concern persisting in the firm.
It aims to scrutinize, interpret, compare and depict useful relationships among financial statements (Balance Sheet, Income Statement). However, managers make these comparisons within and across the statements.
Financial Statement Analysis helps to determine the future course of action. Besides, it involves decision-making about several aspects, some of which are as follows:
- Financial Position
- Investing Decisions
- Profitability
- Strengths and Weakness
Content: Financial Statement Analysis
Tools of Financial Statement Analysis
One can use the following tools to perform financial statement analysis:
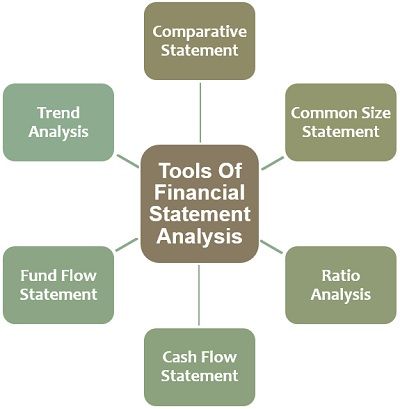
Comparative Statement Analysis
We perform this analysis to assess the financial position of the firm or one or more firms over the years.
In this statement, we compare the current year’s financial statements with previous years. Consequently, we can find out the percentage increase or decrease over a period of time.
Common Size Statement
It involves the vertical analysis of the financial data. It helps in converting complex data into a concise and understandable form.
Besides, these statements depict the relationship of individual items with a common base. The comparisons may take place between different years of the same firm or more than one firm.
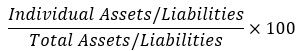
The common base differs in Income Statement and Balance Sheet. Therefore, we can take Net Sales in the case of the Income Statement as a common base. Whereas, Total Assets/Liabilities in the case of Balance Sheet.
The formulas for calculating the percentages are as follows:
Percentage in relation to Common Size Income Statement=

Percentage in relation to Common Size Balance Sheet=
Ratio Analysis
Ratio Analysis is an essential tool for financial statement analysis. It represents a meaningful quantitative relationship between individual & interdependent components of financial statements. However, the outputs are in the form of ratios, percentages, rates and time.
We can use these ratios to determine:
- Firms Financial Position
- Profitability
- Evaluation
- Decision-making
Besides, the classification of the Ratios depends upon the purpose of their evaluation. The heads listed below depict the grouping of ratios according to their purpose:
- Profitability Ratios (Gross profit, Net Profit, Operating Profit, etc.)
- Liquidity Ratios (Current Ratio, Quick Ratio, etc.)
- Activity/ Turnover Ratios (Stock, Debtors, Creditors Turnover Ratios, etc.)
Trend Analysis
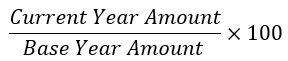
It evaluates the relative change in the behaviour of data over a series of years. We can perform Trend analysis by using Trend Ratios or Index Numbers.
It is useful for making comparisons in the long run. Also, it facilitates Forecasting and Budgeting for the upcoming fiscal year.
We can represent these Indexes in the form of percentages, ratios and graphs. Thereafter, analyze the upward or downward trends of the data.
Trend Ratio/Index Number =
Cash Flow Statements
It depicts the movement of ‘cash and cash equivalents’ in the firm in an accounting year. The analysis includes the evaluation of the net changes in cash from inflow and outflow by:
- Operating Activity
- Financing Activity
- Investing Activity
Fund Flow Statements
A Fund Flow Statement is a tool of Financial Statement Analysis that shows how the enterprise has been financed. This statement shows the summary of sources and utilization of funds.
It depicts the financial health of an enterprise. For this purpose, we need to evaluate changes in working capital during the year.
Types of Financial Statement Analysis
Following are the types of financial statement analysis:
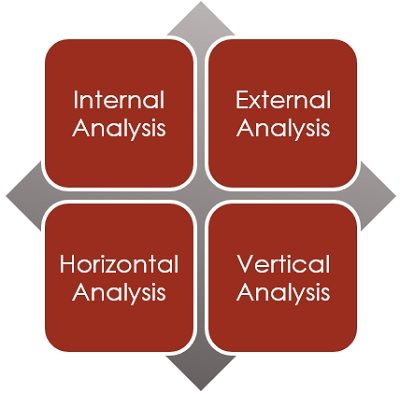
Internal Analysis
In this, the internal management assesses the business’s performance and financial soundness. They have access to all the records and detailed information about the company. Internal management consists of:
- Employees
- Managers
- Auditors
- Top Level Management, etc.
External Analysis
The parties outside the business conduct external analysis. Such parties check the company’s performance for different purposes. They use data published by the company through financial statements in different years.
These outsiders can be:
- Investors
- Financial Institutions
- Statutory bodies, etc
Horizontal Analysis
It helps compare the past year’s performance of the financial statements or individual items. Thus, one can check the trend and patterns in the long run.
Tools used to perform this type of analysis are:
- Comparative Financial Statement
- Cash Flow Statement
- Fund Flow Statement
- Trend Analysis, etc.
Vertical Analysis
When we analyze different items of the same year, taking a common base, then we use the vertical analysis. It is quantitative in nature. Moreover, it indicates the relationship between different items for forecasting and decision making.
Ratio Analysis and common size statements are tools used in the vertical analysis.
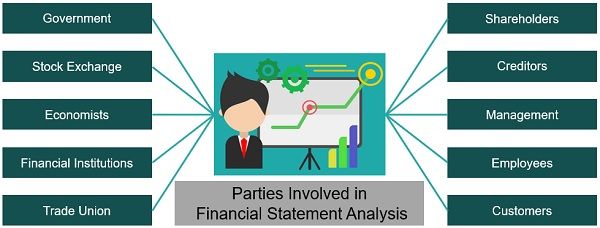
Parties Involved in Financial Statement Analysis
The diagram below depicts various parties involved in carrying out financial statement analysis.
Guidelines for Financial Statement Analysis
- The choice of tools should be appropriate at the time of selection. Use ratios for better interpretations.
- Always refer to the notes provided at the end of the statements. These notes contain information and calculation showing the truthfulness of the published facts.
- Comparison of ratios must depend on the average of the industry benchmarks. Also, the benchmarks of the industry leaders or their own historical ratios.
- Financial Statement Analysis is a complex process. As it requires expertise, logic and a correct approach to perform the analysis. It does not have any mechanical substitute.
- Try to choose those ratios which can provide you with the most information for the analysis.
Importance of Financial Statement Analysis
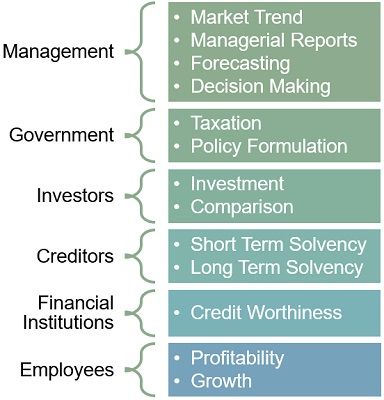
- Management: For analyzing market trends, preparing managerial reports, forecasting and decision making.
- Government: It is a major source of information for taxation and policy formulation.
- Investors: Provides vital information for investment and comparisons with other institutions.
- Creditors: It helps in ascertaining firms’ short-term and long-term solvency.
- Financial Institutions: Institutions check the creditworthiness of the firm through these statements.
- Employees: To know about the profitability and growth of the firm.
Limitations of Financial Statement Analysis
Following are the limitations of the financial statement analysis:
- The difference in Accounting policies, methods, and standards at local and global levels.
- Continuous change in Technology, Trends, Techniques and Tools of evaluation.
- Manipulation by the analyst or firm through unethical practices and misleading facts representation.
- Less reliability and truthfulness due to the analyst’s wrong interpretation or personal bias.
- Selection of the wrong tool of analysis while comparisons are being made.
- Difficulty in analysing firms with a large or diversified product range.
- The analysis is done quantitatively; non-monetary aspects are entirely ignored.
- Many firms do not consider changes in price levels. Therefore, it results in the wrong interpretation during analysis.
- The analysis depends only on the historical data. Many other factors necessary for forecasting may not be taken into consideration.
Final Words
Internal and external beneficiaries carry out financial statement analysis for many purposes. They use horizontal and vertical approaches to use different tools like comparative statements, common-size statements, etc.
Ramchandra says
Good Clarity