Definition: Profitability ratios are the financial measures to analyze the earning capacity and determine the financial soundness of the organization by comparing the earnings with different expenditures, and ensure the optimum utilization of the various resources.
Analyzing the financial position of an organization using the profitability ratios, are essential for all the people associated with the business entity; be its stakeholders, customers, investors and directors.
Content: Profitability Ratios
- Types
- Gross Profit Ratio
- Net Profit Ratio
- Operating Profit Ratio
- Operating Ratio
- Return on Equity
- Return on Asset
- Return on Capital Employed
- Example
- Solution
Types of Profitability Ratios
There are different types of profitability ratios, analyzing and interpreting the financial position and stability of the organization on various parameters.
Some of these ratios holding primary importance for the organization, business associates and public are mentioned below: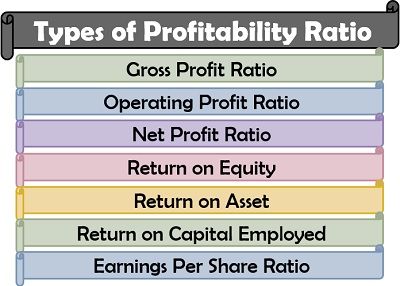
To know more about these ratios in detail, read below.
Gross Profit Ratio
The gross profit ratio determines the percentage of disposable income available with the organization to carry out business operations.
Formula:![]()
Where,
Gross Profit = Net Sales – Cost of Goods Sold (COGS)
Net Sales = Gross Sales – Sales Return – Discount Allowed
Analysis: The gross profit ratio indicates the profit margin of the organization. Thus a higher ratio implies a better earning potential. Gross profit is the profit which excludes any indirect income. It is acquired before deducting any of indirect expense incurred on those activities which are not directly influencing the manufacturing of goods or services.
Net Profit Ratio
The net profit ratio depicts the net income of an organization which is available for the shareholders after paying off all the operating and non-operating expenses.
Formula:![]()
Where,
Net Profit = Gross Profit + Indirect Income – Indirect Expenses
Net Sales = Gross Sales – Sales Return – Discount Allowed
Analysis: This ratio must be high since it indicates the profitability of the organization after paying off administrative and other indirect expenses.
Operating Profit Ratio
The operating profit ratio finds out the organization’s ability to meet the operating expenses.
Formula:![]()
Where,
Operating Profit = Gross Profit – Operating Expenses – Depreciation and Amortization
Net Sales = Gross Sales – Sales Return – Discount Allowed
Analysis: Operating profit ratio is essential for the manufacturing units since it shows the organization’s operational efficiency, therefore it should be high.
Operating Ratio
The operating ratio determines the cost incurred by the organization on its operating expenses in comparison to the sales.
Formula:![]()
Where,
Operating Cost = Cost of Goods Sold (COGS) + Operating Expense
Net Sales = Gross Sales – Sales Return – Discount Allowed
Analysis: The lower is the operating ratio, the better it is for the organization because it implies the expenses incurred on operational activities.
Return on Equity
Return on equity shows the percentage return on the shareholder’s investment in the organization.
Formula:![]()
Where,
Net Profit After Tax = Net Profit Before Tax – Taxes
Analysis: The return on equity or shareholder’s equity should be higher as it indicates an adequate earning capacity of the organization on the owner’s capital.
Return on Asset
The yield on asset determines the company’s ability to earn a profit in comparison to the total assets employed in the business.
Formula:![]()
Where,
Net Profit After Tax = Net Profit Before Tax – Taxes
Analysis: This ration should be high since it depicts an effective utilization of the assets of the organization.
Return on Capital Employed
The return on capital employed depicts the efficiency of the company to generate profits on the money invested.
Formula:![]()
Where,
Earnings Before Interest and Tax = Net Profit Before Interest and Tax
Capital Employed = Total Assets – Current Liabilities
Analysis: The return on capital employed determines the overall financial stability of the organization. Thus a higher ratio means a productive capital investment.
Example
ABC Ltd. records a gross sale of ₹1000000 in the previous financial year. Out of which the sales return was worth ₹10000 and the discount of ₹90000 was allowed. With the help of the following information, find out the various profitability ratios:
- If the cost of goods sold was ₹450000, find out the gross profit ratio.
- The given indirect income is ₹30000, and indirect expense is ₹120000, what will be the net profit ratio?
- It is given that, the operating expenses amounted to ₹125000 and the machine was depreciated by ₹10000. Calculate the operating profit ratio and the operating ratio.
- If the company paid taxes of ₹15000 and shareholder’s equity is ₹1800000, find out the return on equity.
- The total assets amounted to ₹2400000, calculate the return on asset.
- The balance sheet showed current liabilities of ₹1500000, what will be the return on capital employed?
Solution
Gross Profit Ratio = (Gross Profit/Net Sales) ⨯ 100
Net Sales = Gross Sales – Sales Return – Discount Allowed
Net Sales = 1000000 – 10000 – 90000
Net Sales = ₹900000
Gross Profit = Net Sales – Cost of Goods Sold (COGS)
Gross Profit = 900000 – 450000
Gross Profit = ₹450000
Gross Profit Ratio = (450000/900000) ⨯ 100
Gross Profit Ratio = 50%
Net Profit Ratio = (Net Profit/Net Sales) ⨯ 100
Net Sales = ₹900000
Net Profit = Gross Profit + Indirect Income – Indirect Expenses
Net Profit = 450000 + 30000 – 120000
Net Profit = ₹360000
Net Profit Ratio = (360000/900000) ⨯ 100
Net Profit Ratio = 40%
Operating Profit Ratio = (Operating Profit/Net Sales) ⨯ 100
Net Sales = ₹900000
Operating Profit = Gross Profit – Operating Expenses – Depreciation and Amortization
Operating Profit = 450000 – 125000 – 10000
Operating Profit = ₹315000
Operating Profit Ratio = (315000/900000) ⨯ 100
Operating Profit Ratio = 35%
Operating Ratio = (Operating Cost/Net Sales) ⨯ 100
Net Sales = ₹900000
Operating Cost = Cost of Goods Sold (COGS) + Operating Expenses
Operating Cost = 450000 + 125000
Operating Cost = ₹575000
Operating Ratio = (575000/900000) ⨯ 100
Operating Ratio = 63.89%
Return on Equity = (Net Profit After Tax/Shareholder’s Equity) ⨯ 100
Net Profit After Tax = Net Profit Before Tax – Taxes
Net Profit After Tax = 360000 – 15000
Net Profit After Tax = ₹345000
Shareholder’s Equity = ₹1800000
Return on Equity = (345000/1800000) ⨯ 100
Return on Equity = 19.17%
Return on Asset = (Net Profit After Tax/Total Assets) ⨯ 100
Net Profit After Tax = ₹345000
Total Assets = ₹2400000
Return on Equity = (345000/2400000) ⨯ 100
Return on Equity = 13.38%
Return on Capital Employed = (Earnings Before Interest and Tax/Capital Employed) ⨯ 100
Earnings Before Interest and Tax = Net Profit Before Interest and Tax
Earnings Before Interest and Tax = ₹360000
Capital Employed = Total Assets – Current Liabilities
Capital Employed = 2400000 – 1500000
Capital Employed = ₹900000
Return on Capital Employed = (360000/900000) ⨯ 100
Return on Capital Employed = 40%
The business entities keep on measuring the profitability of its operations from time to time.
This is done to examine the performance of the organization, along with the returns yield by the investments made.
Kavitha says
tnqu