Definition: Producer Equilibrium is the combination of price and output that yields maximum profit. Besides, it is the point where the producer maximizes profit or minimizes losses.
Briefly, it is an output level where profit is maximum and firms have no intent to change it.
It is alternatively known as Firm Equilibrium, Profit Maximization or Loss Minimization.
In general, equilibrium is a state of no change. So, firms don’t change their pricing and production policy when in equilibrium. Therefore, it is the point of optimum profit.
The producer will be nonprofitable at any point above and below equilibrium.
Besides, the firms must stress on two aspects:
- What output level must be produced that will maximize profit?
- At what price the firm must sell its products?
Content: Producer Equilibrium
- Who is a Producer?
- Methods
- Cost Curves
- Producer Surplus
- Producer Equilibrium conditions under Short Run and Long Run
- Final Words
Who is a Producer?
A producer is an individual or firm who is engaged in the activity of production of goods and services.
A producer gets satisfaction when he earns a profit. However, he becomes profitable when revenue is more than cost.
Methods of Determining Producers Equilibrium
We can determine the equilibrium point for firms using two methods given below:
- TR – TC Approach
- MR – MC Approach
TR – TC Approach
In this method, firms ascertain the variance between TR and TC at various output levels. And, the output generated by calculating variance is in the form of Profit or Loss.
Total Profit (TP) = Total Revenue (TR) – Total Cost (TC)
When,
TR = TC
Producer earns zero profit
TC > TR
Producer suffers loss
TR > TC
Producer earns profit
Producer Equilibrium Condition
The maximum difference between TR and TC signifies optimum profit. Thus, producer equilibrium is when the TR and TC difference is maximum at a specific output level.
Let’s understand it in two situations:
- Perfect Competition
- Non-perfect Competition
Perfect Competition
Here, the firms operate in a perfectly competitive market where price remains constant. In addition, the firms are ‘Price Takers’ and ‘Quantity Adjusters’.
In perfect competition, the TR curve moves upwards towards the right and forms a straight line.
Graphical Presentation
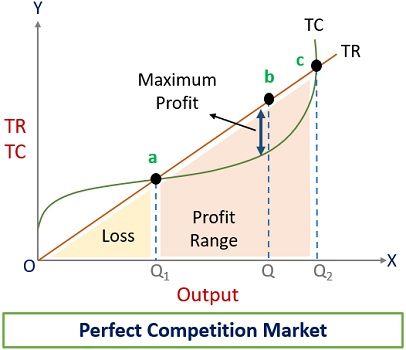
- Below ‘a’, the firm will suffer a loss in production as the cost is more than revenue.
- The producer will be at equilibrium at ‘b’ in the profit range. This is because the vertical distance between TR & TC is maximum.
- After ‘c’, firms will stop production as it is a break-even point.
Non-perfect Competition
It is a situation of Monopoly and Monopolistic competition. Here, the firms can sell more only when they reduce products price. Thus, the price gets reduced due to an increment in output.
In non-perfect competition, the TR curve isn’t a straight line. This is because it is affected by MR. So, the TR curve rises up but at a decreasing rate.
Graphical Presentation
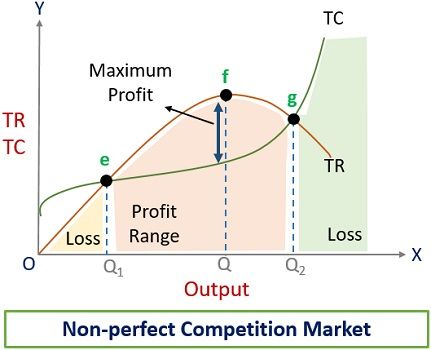
- The producer will suffer loss at any point below ‘e’ and after ‘g’.
- Point ‘f’ depicts the maximum difference between TR and TC. Hence, the producer will be at equilibrium at ‘f’.
Limitation of TR-TC Approach
This method is unsuitable because:
- It is a geometric method, and measuring the distance between TR and TC is challenging.
- Difficulty in measuring the per unit profit and cost from the figure.
MR – MC Approach
We ascertain the firm’s equilibrium output level by comparing MR with MC in this method.
The production is said to be profitable when MR is more than MC. However, firms will earn an optimum profit when MR is equal to MC. If the firms carry out production beyond this level, they will suffer losses.
Producer Equilibrium Condition
Firms must fulfil two conditions given below to reach equilibrium:
- Necessary condition: MR = MC
- Supplementary condition: MC must intersect MR from below
Let’s understand it in two situations:
- Perfect Competition
- Non-perfect Competition
Perfect Competition
In a market with perfect competition, AR is equal to MR. And, MR is a horizontal straight line due to constant price.
Graphical Presentation
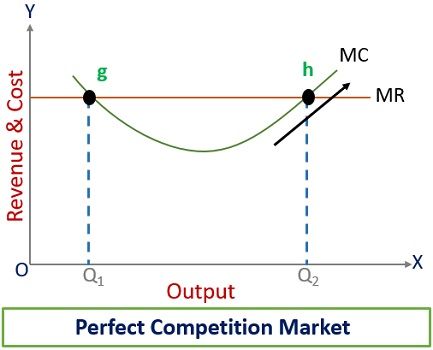
- MR is equal to MC, i.e. at ‘g’ and ‘h’ at two points.
- The firm will be at equilibrium at the Q2 level of output.
- At point ‘h’, MC is rising, intersecting MR from below.
Firms would have lost the opportunity to earn more profit if would have paused production at ‘g’.
Non-perfect Competition
Here, the firms have to lower prices to boost sales. Consequently, the MR curve moves downwards towards the right.
Graphical Presentation
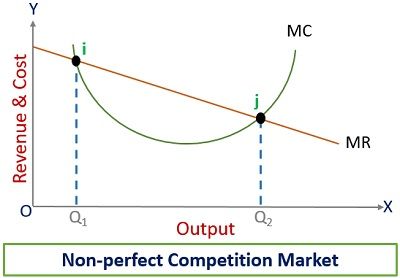
- At ‘i’, MC equals MR but still has the opportunity to earn more profit.
- Firms will suffer losses beyond ‘j’.
- Hence, Q2 is the quantity that will provide optimum profit.
Producers Equilibrium and the cost curves
Isoquant Curves
Isoquant curves represent different combinations of inputs producing the same output level.
Iso-cost Lines
It represents the combinations of two inputs that possess the same cost.
Producer Surplus
Sometimes, firms are ready to sell below the equilibrium price. The difference between the equilibrium price and the minimum acceptable price is Producer Surplus.
Producer Equilibrium conditions under Short Run and Long Run
Short Run
In the short run, supply can’t be adjusted with demand. Consequently, firms may bear a loss, which is called a Minimum Loss. The reason behind it is that the firm has to bear fixed costs despite the production being more, less or zero.
- MR = MC
- Post reaching equilibrium, MC must be greater than MR
- The price must be greater or equal to AVC
Long Run
Here, all the factors of production are variable. However, firms can adjust supply with demand. Besides, there is a possibility of entry and exit of other firms.
- MR = MC
- Post reaching equilibrium, MC must be greater than MR
- Price is equal to more than AC. If this condition is fulfilled, the firms will not suffer long-term losses.
Final Words
To sum up, firms carry out production intending to earn profit. For this purpose, they try to find a profitable combination of price and output.
The equilibrium point is the state at which he earns a maximum profit. Besides, profits will decline beyond the equilibrium point. Therefore, firms determine the output level that provides maximum profit.
Leave a Reply