Definition: A break-even point is that position where a business entity can recover its cost through the revenue it generates from the sales. Here, we can say that the company is now able to meet its expenses through its sales revenue.
Break-even analysis is the means to identify the effect of variation in sales volume on the cost, revenue and profitability of a project or a product. It consists of several calculations, based on which the business organizations determine the feasibility and viability of starting a new project or producing a new product.
It is just an estimation of sales and does not determine the actual revenue generated by the products or projects.
Content: How to Calculate Break-Even Analysis?
Assumptions of Break-Even Analysis
To simplify the process of computing the break-even analysis, the following assumptions are taken into consideration:
- Total fixed costs remain constant at all the output levels.
- All the costs can be considered as either fixed or variable costs.
- Straight-line cost and revenue behaviour.
- Throughout the output level, sales price per unit is constant.
- The business has a constant product mix and produces only one kind of product.
- The inventory remains constant at the start and the end of the accounting period.
- Costs and sales revenue is affected only by the sales volume.
- The unit variable cost remains constant since the change in total variable cost is considered to be proportionate to the output level.
- The other factors such as efficiency, production and technology do not change.
Components of Break-Even Analysis
Break-even analysis is done by establishing a relationship between three significant elements of a project, i.e., costs, revenue and contribution margin.
Let us go through each of these components in detail below: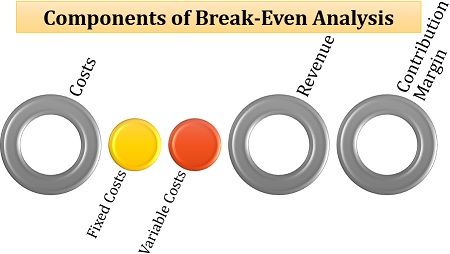
- Costs: The total expenses incurred on a project or product is its cost. It can be categorized as follows:
- Fixed Costs: Those costs which remain the same throughout irrespective of the sales or revenue are known as the fixed costs, e.g. rent, interest, depreciation, etc.
- Variable Costs: The expenses which are progressive with the increasing sales and production volume are called variable costs, e.g. raw material, fuel, electricity, etc.
- Revenue: The return generated from the sales of a product during a particular period is termed as revenue. In simple terms, it is the total sales value or amount.
- Contribution Margin: Contribution margin is the ratio of the revenue available for meeting fixed costs per unit to the sales price of each unit.
Computation of Break-Even Point
Break-even analysis is an essential tool in the hands of the business experts, management, financial experts and professional for determining the success possibilities of a project on various parameters.
These parameters can be better understood in the following discussion:
Break-Even Point
Break-even point is that point of sale where the company can meet the project’s cost from the revenue generated by that particular project.
The formula for determining the break-even point is as follows:
![]() or,
or,![]() or,
or,![]()
The number of units denotes break-even point.
Cash Break-Even Point
We know that it is quite challenging for the new projects to attain the break-even point in the first few years of business. Therefore, for the concept of cash break-even point was introduced where the total revenue generated is equivalent to the total cash expenditure incurred.
Following is the formula to calculate the cash break-even point:
![]() Where,
Where,
![]() and,
and,![]() In the above equation, an adjustment is made, i.e., depreciation which was previously included in the total cost is deducted from it, to exclude it in the total cash cost.
In the above equation, an adjustment is made, i.e., depreciation which was previously included in the total cost is deducted from it, to exclude it in the total cash cost.
Contribution Margin Ratio
This ratio provides the percentage of the sales revenue generated from the project, which is available to meet its fixed cost.
The formula for finding out the contribution margin ratio is as follows:
![]() It is denoted in the percentage value.
It is denoted in the percentage value.
Contribution Margin Per Unit
Contribution refers to the amount of sales revenue which is available to pay off the fixed cost of the project after meeting the variable cost. Per unit contribution margin determines the amount available for meeting the fixed cost of each unit of the product.
Let us see the equation for calculating the contribution margin per unit:
![]() It is denoted in the amount.
It is denoted in the amount.
Margin of Safety
The actual sales made over the break-even point, which generates profit is considered as the margin of safety.
The formula for the margin of safety is depicted below:
![]() It is merely the difference between the total sales and the sales at the break-even point, denoted in amount.
It is merely the difference between the total sales and the sales at the break-even point, denoted in amount.
Margin of Safety Ratio
The percentage representation of the margin of safety is called a margin of safety ratio.
Its formula is as follows:
![]() It indicates the profitability and strength of a business. It also helps to find out whether the company is financially sound and can keep up even after a slight fall in sales.
It indicates the profitability and strength of a business. It also helps to find out whether the company is financially sound and can keep up even after a slight fall in sales.
Profit Volume Ratio
The profit volume ratio depicts the percentage of contribution generated from the sales of the product.
The formula of P/V ratio is:
![]() Higher the P/V ratio, better is the profitability of the business.
Higher the P/V ratio, better is the profitability of the business.
Composite Break-Even Point
Now, we can also determine the break-even point for the business units manufacturing multiple products.
The related equation is given below:
![]() The composite break-even point denotes sales revenue which a firm needs to generate for meeting up its total cost.
The composite break-even point denotes sales revenue which a firm needs to generate for meeting up its total cost.
Example
XYZ Ltd. manufacture bags and the selling price is ₹100 per bag. If ₹200000 is the fixed cost, and the variable cost increases proportionately to the sales, costing ₹50 per unit. Also, ₹20000 was charged as depreciation.
The following table explains the sales revenue and the number of units sold:
| Units Sold | Revenue |
|---|---|
| 1000 | 100000 |
| 2000 | 200000 |
| 3000 | 300000 |
| 4000 | 400000 |
| 5000 | 500000 |
| 6000 | 600000 |
| 7000 | 700000 |
| 8000 | 800000 |
With the help of the above data, calculate the break-even analysis.
BreakEven Point=Fixed Cost/(Sales Price-Variable Cost)
BreakEven Point=200000/(100-50)
BreakEven Point=4000 units
Cash BEP=Cash Fixed Cost/Cash Contribution Per Unit
Cash BEP=180000/55
Cash BEP=3273 units (rounded off)
Cash Fixed Cost=Fixed Cost-Depreciation
Cash Fixed Cost=200000-20000
Cash Fixed Cost=₹180000
Cash Contribution Per Unit=Sales Price Per Unit-(Variable Cost Per Unit-Depreciation Per Unit)
Cash Contribution Per Unit=100-[50-(20000/4000)]
Cash Contribution Per Unit=100-(50-5)
Cash Contribution Per Unit=₹55
Contribution Margin Ratio=(Contribution Margin Per Unit/Sales Price Per Unit)x100
Contribution Margin Ratio=(50/100)x100
Contribution Margin Ratio=50%
Contribution Margin Per Unit=Sales Price Per Unit-Variable Cost Per Unit
Contribution Margin Per Unit=100-50
Contribution Margin Per Unit=₹50
Margin of Safety=Total Sales-Sales at BreakEven Point
Margin of Safety=800000-(100×4000)
Margin of Safety=₹400000
Margin of Safety Ratio=(Margin of Safety/Sales)x100
Margin of Safety Ratio=(400000/800000)x100
Margin of Safety Ratio=50%
Profit Volume Ratio=(Contribution/Sales)x100
Profit Volume Ratio=(400000/800000)x100
Profit Volume Ratio=50%
Contribution=Total Sales Price-Total Variable Cost
Contribution=800000-(50×8000)
Contribution=₹400000
Suppose the manufacturer expands his business and now sells three products, i.e., bags (as given above), t-shirts and track pants. The related data is given in the below table:
| Products | Total Fixed Cost (₹) | Total Contribution (₹) | Total Sales (₹) |
|---|---|---|---|
| Bags | 200000 | 400000 | 800000 |
| T-Shirts | 300000 | 600000 | 1200000 |
| Track Pants | 500000 | 1000000 | 2000000 |
| Total | 1000000 | 2000000 | 4000000 |
Find out the Composite Break-Even Point.
Composite BreakEven Point=Total Composite Fixed Cost/Composite Profit Volume Ratio
Composite BreakEven Point=1000000/50
Composite BreakEven Point=₹20000
Composite P/V Ratio=(Total Composite Contribution/Total Composite Sales)x100
Composite P/V Ratio=(2000000/4000000)x100
Composite P/V Ratio=50%
Break-Even Chart
Break-even analysis of the above example can be better understood with the help of the following graph: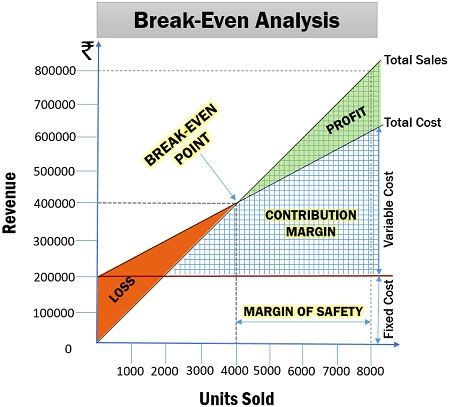
In the above diagram, we can identify the break-even point at (4000,400000) where the total sales and total cost cut each other. Moreover, the contribution margin also includes the profit generated by the business.
Ann says
Good work easy to understand