Definition: Supply Curve represents a pictorial depiction of the price and quantity relation of the commodities. Its shape is driven by cost behaviour, and the cost behaviour is constant to the uncertain trend of prices in the input market. If the company manufacture more products, it leads to a high cost per unit, and then the company shows the explicit relation amidst the price and the supply and depicts the high inclined supply curve.
For understanding the supply curve, it is necessary to understand the law of supply first.
Content: Supply Curve
- Law of Supply
- Exceptions to the law of Supply
- Determinants of Supply Curve
- Shift of the Supply Curve
- Movement along the Supply Curve
- Types of Supply Curve
- Supply Functions
- Conclusion
Law of Supply
Law of Supply sets up a relation amidst price and quantity of the supplied products. In accordance with this law, the supply of product will also raise when the price of the product raises, and when the price declines the supply also declines, although all other elements remain constant. This happens because the price and supply are directly related to each other, and it’s obvious that if prices increase the manufacturer will also like to raise their profits for which they sell more products and therefore supply of products increases. The more the price the seller will get more induced to sell products; however, the low price decreases the profit margin, so the producers reduce the supply of products.
But the price cannot decline below a certain fixed point, and if it falls below that the producers may stop the supply of their products and such price below which the manufactures are not ready to sell their product is termed as “Reserved Price”. And this price depends upon the product’s durability, predicted price, storage charges and the transportation charges, etc. Although, to stop a supply of products for a longer period is not possible as the manufacturer would also need a return on their investment as soon as possible.
Exceptions to the law of Supply
In the following circumstances law of supply does not apply:
- In the case of agriculture goods, the natural factors affect the supply of goods; thus, here law of supply does not apply.
- If the goods are of perishable nature the law does not apply to it as the seller want to sell as much as goods they can sell, otherwise, it will be ruined. Thus, the supplier sells it at lower prices also.
- The goods having social discrepancies does not follow the law of supply as these will stay limited even if their prices are high.
Determinants of Supply Curve
As we know the Supply curve is a portion of a marginal cost curve; thus, the elements accountable for marginal cost curve shift are the sources of the supply curve.
These elements are as follows:
- Variations in the costs of related products.
- Excise duties.
- Technical changes.
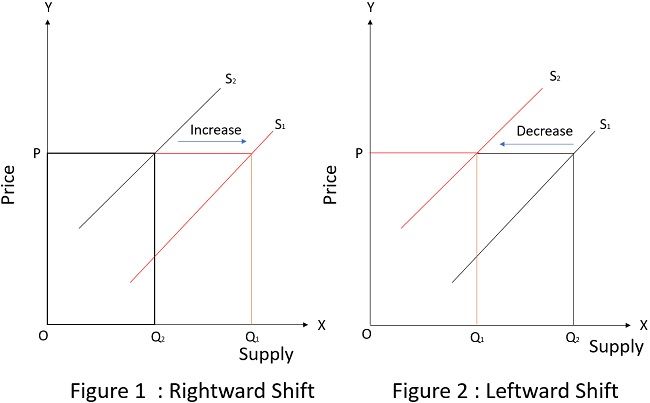
Shift of the Supply Curve
Supply curve can shift on the basis of two elementary manners. An increase in the supply denotes a rightward shift of the supply curve, which means that at any price, people will supply a higher quantity of the products than before. This is diagrammatically shown below in figure 1 in which S1 Curve shifts to the rightward S2 Curve. And decreases in supply denotes a leftward of the supply curve, i.e., at any given price people supply a lower quantity of products than before. This can be understood with figure 2 below in which the S1 curve shifts to the S2 curve.
Movement along the Supply Curve
The shift because of change in its own price is known as movement along the supply curve. i.e., change in price because of the change in quantity supplied. As shown in the graph below the movement from point P to Q is a movement along the supply curve, because of price fall, the quantity supplied falls along with S1. Here a price fall from ₹ 400 to ₹ 300 leads to a fall in the supply of quantity from 12,000 to 10,000 tickets.
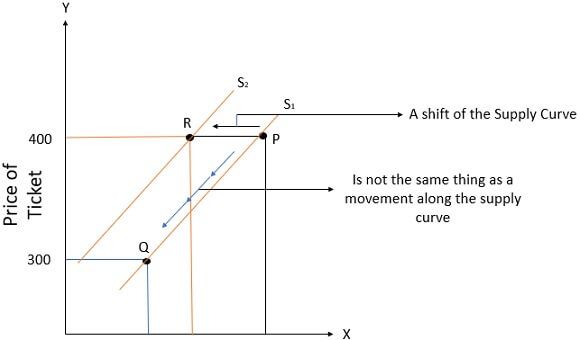
However, it may also fall even if the price has not changed, but there is a decrease in supply, i.e., a supply curve gets tilt close to the left which is shown in a given graph below as a leftward shift from S1 to S2 although the price is constant at ₹ 400. The supply of quantity diminishes from 12,000 to 10,000 tickets at point R on S2.
Types of Supply Curve
A supply curve is divided into two parts:
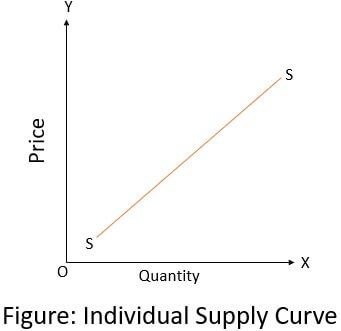
- Individual Supply Curve
An individual supply curve is the graphical representation of the individual supply schedule, which represents the production of the quantities of the specific products suggested for sale at distinct prices by a specific company. It is shown below in a graphical form:
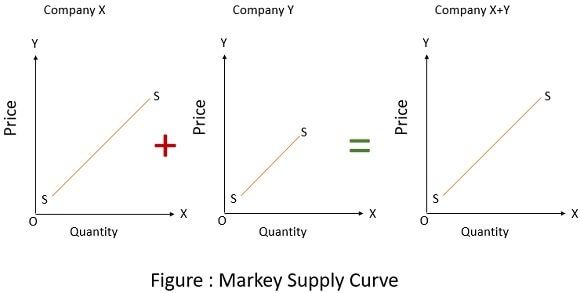
- Market Supply Curve
It is the pictorial representation of the market supply schedule which shows the production of the quantities of a specific product presented for sale at a fixed price by all the companies in the market selling that particular product. Pictorial representation is shown below:
Supply Functions
Based on the factors affecting supply it can be written as follows:
![]()
Where;
Sx = Supply of X product.
F = Function
Px = Price of X product.
Pr = Price of other product.
Pf = Price of factors of production
T = Change in technology.
G = Goals of a company.
N = Natural factors.
C = Means of transportation and communication.
Tp = Taxation policy.
A = Agreement among manufacturers.
Conclusion
The Supply Curve displays the goods supplied for a particular period at any cost. A change in the supply of goods can be because of technological changes, cost of production, etc.
Leave a Reply