There are many goods whose consumption and price are affected by other goods. These goods are known as related goods, which act as Complements and Substitutes for each other.
For Instance, when you buy a Desktop, you buy a Keyboard, CPU and UPS along with it. On the contrary, a customer can also buy a Laptop instead of a Desktop. Thus, all these products are the related goods of the Desktop.

Any change in the price of the Desktop will affect the demand and price of its complements and substitutes. The rise or fall in the price of one product results in the increase or decrease in the sale of another.
It plays a significant role in the field of microeconomics. As, it helps in estimating the following:
- Demand and Supply of Goods
- Price Elasticity
- Cross-price Elasticity of Demand
Besides, business can form a compelling and impactful business strategy. This is because, it is one of the significant determinants of the price elasticity of demand.
As a customer, we use many Complements and Substitute goods on a daily basis. In this post, you will understand what Complements and Substitutes are. In addition, some examples, graphs and differences between them.
Content: Complementary and Substitute Goods
- What is Substitute Goods?
- What are Complement Goods?
- Complementary and Substitutes Graph
- Cross-elasticity of Demand
- Difference Between Substitutes and Complementary Goods
- Bottom Line
What is Substitute Goods?
It implies those goods which can be used as replacements for each other to satisfy a want. Such products are tough competitors for each other.
Substitute goods share a direct relation between price and demand. The rise in the price of one product leads to a rise in the demand for another product and reverses.
Example of Substitute Goods
A very common and frequently used example of substitute goods is Tea – Coffee and Sugar – Jaggery. If the company increases the Tea’s price, customers will start buying coffee. Consequently, the demand for coffee will increase.
Some more examples of substitute goods are as follows:
- Smartphone Brands
- Ride-sharing apps
- Shopping Websites
- Toothpaste Brands
- Beverages, etc.,
What are Complement Goods?
It implies those goods which complement each other and are less valuable when consumed alone. Such products can provide maximum satisfaction to customers jointly. Thus, they have joint demands and complete each other regarding usage.
Complement goods have an inverse relationship with each other. The fall in the price of one good will increase the demand for another and reverse.
Example of Complementary Goods
You might have always used Bread – Butter and Remote – Batteries together. If the price of Bread increases and customers decrease its consumption, then the demand for Butter will automatically fall.
More such examples are as follows:
- Car and Petrol
- Shoes and Laces
- Tiffen and Tiffen Covers
- Pizza and Pizza Seasoning
- Mobile and Mobile Covers
Complementary and Substitutes Graph
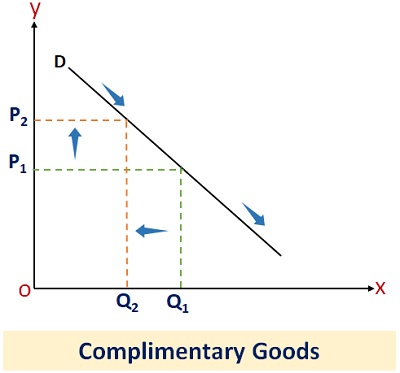
The graph of Complementary Goods is as follows:

In the above graph:
- The x-axis shows the quantity demanded, and the y-axis shows the price.
- P1 and Q1 depict the original Price and Quantity, while P2 and Q2 depict the new Price and Quantity.
- The demand curve (D) is a downward-sloping curve.
- The increase in the price from P1 to P2 results in a decrease in the quantity from Q1 to Q2.
- Therefore, it shows an inverse relationship between price and quantity.
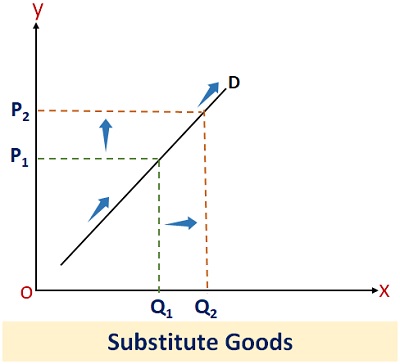
The graph of Substitute Goods is as follows:

In the above graph:
- Demand curve (D) slopes upward.
- The increase in the price from P1 to P2 results in an increase in the quantity from Q1 to Q2.
- Thus, it is evident that a direct relationship exists between Price and Quantity Demanded.
Cross-elasticity of Demand
It measures the changes in commodity demand due to the changes in the complementary and substitute goods prices.
The responsiveness is known as Elasticity, and the elasticity of related goods is called the cross-elasticity of demand. The cross-elasticity value can range between minus infinity and plus infinity.
Various market structures are classified based on the cross-elasticity of demand. For example, the cross-elasticity between producers is infinite in a perfect competition market. In contrast, in the absolute monopolistic market, the product’s cross-elasticity is zero.
Cross-elasticity of Demand Formula
We can calculate it by dividing the percentage change in the quantity demanded of Good 1 by the per cent change in the quantity demanded of Good 2.
It is expressed in the formula as:
A positive result indicates that the two goods are substitutes. On the contrary, a negative result is an indication of complementary goods.
When the cross-elasticity is:
- Greater than Zero: In this case, the related goods are said to be substitutes. The higher numeric value indicates a greater degree of substitutability.
- Less than Zero: It implies that the two goods are complementary to each other. The lower the numeric value, the greater the degree of complementarity.
- Equal to Zero: It occurs in the case of unrelated goods. Here, any fluctuation in price does not affect the demand for the related goods.
Solved Example
Suppose RST Company manufactures Gel Pens. A 10% rise in the Gel Pen’s price increases the Ball Pen’s demand by 20%. Find the cross-elasticity between the two. In addition, ascertain whether the products are substitutes or complements.
Solution:
By applying the above formula:
Cross-elasticity of Demand = % ∆ QD Good A / % ∆P Good B
Cross-elasticity of Demand = 10/30 = 0.33
Thus, the answer is positive, which means Gel Pens and Ball Pen are substitutes.
Difference Between Substitutes and Complementary Goods
| Basis | Substitute Goods | Complementary Goods |
|---|---|---|
| Demand Curve | Upward Sloping | Downward Sloping |
| Nature of Demand | Competitive Demand | Joint Demand |
| Type of Demand | Direct | Inverse |
| Dependency | Independent | Interdependent |
| Cross-elasticity of Demand | Negative | Positive |
Bottom line
To sum up, studying and analyzing related goods are crucial while forming business strategies. It plays a crucial role in the field of both economics and marketing.
In microeconomics, it helps measure the impact of complements and substitutes on price and output. However, it is vital in developing pricing strategies.
Leave a Reply