Definition: PERT or Project Evaluation and Review Technique can be understood as a tool for handling programmes and projects which involve a series of activities. It supports the analysis of these actions and their sequential arrangement, along with determining the proposed duration required for completing each of these tasks with the help of drafting a critical path, is termed as PERT analysis.
While developing a submarine missile program, this technique was invented at the Special Projects Office by the U.S. Navy in the year 1950.
Content: PERT Analysis
PERT in Project Management
PERT is commonly used for research projects or the programs which have not been executed earlier.
This means that, when an organization does not have any experience of implementing a program or working on a specific project, PERT proves to be an appropriate statistical tool.
When the organization undertakes a new project, it becomes difficult to determine the time within which the project has to be completed.
Therefore, to provide the deadline for every task involved in the project and guide them on the sequence of all the activities, PERT analysis is considered to be the most suitable method.
It is also a handy tool for budgeting such a project. This is because having an idea of the estimated duration will help the management to ascertain the need for financial and human resources; and their acquisition.
PERT Chart / Project Network
The project network helps the management to pen down their time estimation of completing a project.
It also provides an idea of the series in which the various activities are to be carried out and the proposed time taken to complete each task.

In the above network diagram, we can quickly identify the following elements:
- Event: An event can be understood as the node at which an activity starts or ends.
- Activity: It refers to the actions taken or the task to be accomplished as a part of the whole project execution process. In brackets, the estimated time required for performing the particular task is mentioned. It can be in hours, days, weeks or months.
- Critical Path: The path which passes through all those essential activities which are carried out in a sequence and links the first event to the last event.
PERT Analysis Formulae
PERT seems to be a complicated method; however, it is not so if we have a basic understanding of the formulae used in this technique.
Let us what all we need to compute under PERT analysis:
Estimated Duration
The duration which is supposedly required to accomplish a specific task is termed as an estimated duration. It is calculated through the following formula: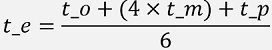
Components for Determining Estimated Duration:
In the above method, the following elements play a significant role:
- Optimistic Time Estimate (t_o): Having a highly positive attitude, this is the least possible time within which a particular activity can be completed.
- Most Likely Time Estimate (t_m): It is a balanced approach, estimating the most appropriate time for completion of any activity.
- Pessimistic Time Estimate (t_p): Considering all the negative aspects, it is the highest possible time estimation for carrying out a particular activity.
Variance
The level of volatility of the time required to carry an activity from the average time is termed as variance in PERT analysis.
The given formula is used to determine the variance of each activity in project management: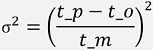
Critical Path Evaluation
The critical path is the most extended way of the PERT Chart connecting those nodes which fulfil all the four conditions.
Also, the related activities should be in a series right from the first event to the last event.
The following conditions must be fulfilled to find out the critical path by using PERT in a given project network:
Earliest Start Time:
It is a forward pass which begins with event 1.
Formula:![]()
Where,
- ESj is the Earliest Start Time of Ending Node;
- ESi is the Earliest Start Time of Starting Node and;
- Dij is the Estimated Duration of Concerned Activity.
- Also, max_i denotes that when an ending node consists of more than one starting nodes, the highest ESj out of all the values is considered.
Latest Completion Time:
It is a backward pass which starts in the reverse order from the last node or event.
Formula:![]()
Where,
- LCi is the Latest Completion Time of Starting Node;
- LCj is the Latest Completion Time of Ending Node and;
- Dij is the Estimated Duration of Concerned Activity.
- Also, min_j signifies that in case of two or more ending nodes for a particular starting node, the least LCi value is taken into consideration.
PERT Example
A company well-known for health supplements planned to make a new health drink for women.
The project details of this product development have been summarized below:
| Activity | Activity Description | Immediate Predecessor | Optimistic Time Estimate (t_o) | Most Likely Time Estimate (t_m) | Pessimistic Time Estimate (t_p) |
|---|---|---|---|---|---|
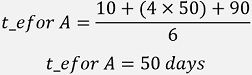
| A | Market Research and Analysis | 10 | 50 | 90 | |
| B | Customer Need Identification | A | 10 | 20 | 30 |
| C | Product's Proposed Features and Specifications | A | 15 | 20 | 25 |
| D | Competitive Analysis | A | 40 | 60 | 80 |
| E | Sample Study | B | 30 | 40 | 50 |
| F | Product Development | C | 40 | 50 | 120 |
| G | Potential Market Analysis | D | 10 | 30 | 50 |
| H | Product Differentiation | D | 10 | 20 | 30 |
| I | Cost Estimation | E | 5 | 10 | 15 |
| J | Product Testing and Approval | F,G | 30 | 35 | 70 |
| K | Product Pricing | H,J | 6 | 10 | 14 |
| L | Product Launch | I,K | 15 | 30 | 45 |
Considering the above table, determine the following:
- Project network;
- Expected duration and variance of every activity;
- Critical path and expected project completion time; and
- Probability of project completion on or before 225 days.
Solution
Solution 1. Project network:
The pert chart for this problem is given below: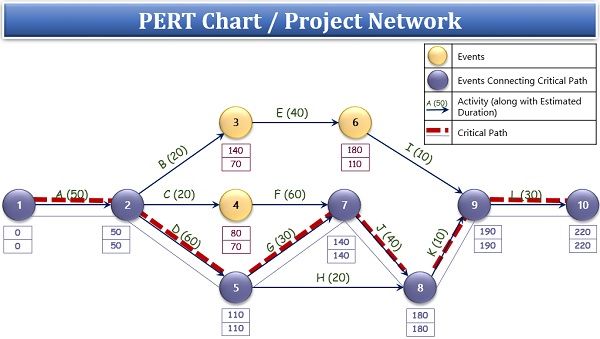
Solution 2. Expected duration and variance of every activity:
Calculation of Expected Duration:
For Activity A:
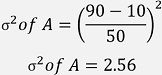
 Finding the Variance of each Activity:
For Activity A:
 Likewise, we have calculated the expected duration and variance of all the activities in the table given below:
| Activity | Activity Description | Estimated Duration (t_e) | Variance |
|---|---|---|---|
| A | Market Research and Analysis | 50 | 2.56 |
| B | Customer Need Identification | 20 | 1.00 |
| C | Product's Proposed Features and Specifications | 20 | 0.25 |
| D | Competitive Analysis | 60 | 0.44 |
| E | Sample Study | 40 | 0.25 |
| F | Product Development | 60 | 2.56 |
| G | Potential Market Analysis | 30 | 1.78 |
| H | Product Differentiation | 20 | 1.00 |
| I | Cost Estimation | 10 | 1.00 |
| J | Product Testing and Approval | 40 | 1.31 |
| K | Product Pricing | 10 | 0.64 |
| L | Product Launch | 30 | 1.00 |
Solution 3. Evaluating the critical path and the expected project completion time:
For the critical path, we need to calculate:
Earliest Start Time:
The earliest start time for the first event will always be 0.
With the help of given formula, the earliest start time is computed as follows:
For Event 3: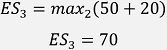
Events 7 and 8 have the maximum value selection concept, therefore: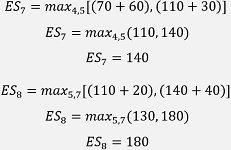
Latest Completion Time:
The latest completion time for event 10 is equivalent to the earliest start time of event 10.
Let us find out the LCi with the help of the given equation:
For Event 6: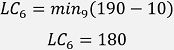
Event 5 is the minimum value selection concept; hence: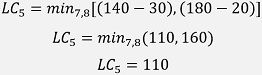
Similarly, we can determine the earliest start time and latest completion time for all the events or nodes. The ESj and LCi for all the ten events are as follows:
| Event | Earliest Start Time (ESj) | Latest Completion Time (LCj) |
|---|---|---|
| 1 | 0 | 0 |
| 2 | 50 | 50 |
| 3 | 70 | 140 |
| 4 | 70 | 80 |
| 5 | 110 | 110 |
| 6 | 110 | 180 |
| 7 | 140 | 140 |
| 8 | 180 | 180 |
| 9 | 190 | 190 |
| 10 | 220 | 220 |
As we know that the critical path is the longest path of the PERT Chart connecting the nodes which fulfil all the four conditions mentioned above.
The critical path is:![]()
And the expected project completion duration is:
50+60+30+40+10+30=220 days
Solution 4. Probability of project completion on or before 225 days:
For this computation, we will require the summation of estimated duration and total variance of the activities lying in the critical path. The following table will provide the required data:
| Activity | Estimated Duration (t_e in Days) | Variance |
|---|---|---|
| A | 50 | 2.56 |
| D | 60 | 0.44 |
| G | 30 | 1.78 |
| J | 40 | 1.31 |
| K | 10 | 0.64 |
| L | 30 | 1.00 |
| Total | 220 | 7.73 |
Let us first determine the value of z: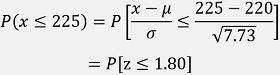
Thus,
To find out the probability, we have to use the Standard Normal Distribution Table, where the value of 1.80 is 0.9641.
To convert this value in percentage, we have to multiply it with 100; hence we get:
Probability of project completion on or before 225 days = 96.41%
Conclusion
Some may find PERT Analysis to be a complicated method; however, it is an entirely practical approach in business project planning, which involves huge finance. It also facilitates capital budgeting decisions of an organization.
Leave a Reply